
Click map analytics: a practical guide for marketers
Click map analytics is the practice of capturing every click or tap on a webpage and rendering those interactions as a colour-coded visual overlay, so you
TL;DR:


TL;DR: Quick Answer
Click map analytics is the practice of capturing every click or tap on a webpage and rendering those interactions as a colour-coded visual overlay, so you
Key takeaways
- Very cheap quotes (under R5,000) almost always exclude copywriting, SEO, custom design and post-launch support
- Professional copywriting can represent 20-35% of a total website project cost, and is worth it for search visibility
- On-page SEO built into the website at launch costs a fraction of what it costs to retrofit after the site is live
- Hosting, SSL, domain and maintenance add R3,000-R10,000 per year on top of build cost
- E-commerce adds significant cost due to payment gateway integrations, product data, security requirements and checkout UX
- Timeline and client responsiveness directly affect cost: slow feedback rounds extend agency hours
TL;DR:
- Click map analytics visualises user interactions on a website, helping marketers identify which elements attract attention.
- South African sites must handle click data carefully under POPIA by obtaining consent and ensuring data anonymisation.
- Effective setup involves selecting key pages, deploying a tracking script, verifying data capture, and segmenting by device and traffic source.
Click map analytics is the practice of capturing every click or tap on a webpage and rendering those interactions as a colour-coded visual overlay, so you can see at a glance which elements attract attention and which are ignored. As a click heatmap, it aggregates hundreds or thousands of individual events into a single, readable picture of user intent. For South African marketers and web analysts, it is one of the fastest ways to diagnose why a call-to-action (CTA) underperforms or why visitors drop off before converting.
Because click capture records where a user's cursor or finger lands, it sits close to personal-data territory. South African sites must handle this under the Protection of Personal Information Act (POPIA), which means consent banners, documented lawful basis, and strict retention limits before you go live. Tools like Microsoft Clarity offer built-in anonymisation controls that make POPIA compliance more manageable.
Device mix matters too. Statista's retail device data shows that desktop and mobile visits behave very differently, and a click map that ignores that split will mislead you. Juicydesigns builds device-segmented click-map audits into every CRO engagement to account for different user behaviours on desktop and mobile devices.
How does click mapping work technically?
The capture flow has four steps: a client-side tracking script loads on the page, records each click or tap event (X/Y coordinates or the DOM element), attaches metadata (device type, viewport size, timestamp), and sends that data to the vendor's servers. The vendor then deduplicates, groups events by element or coordinate cluster, applies a heat-colour scale, and renders the overlay on a screenshot of your page.
Clicks are active intent signals, a user chose to interact, not just glance. That makes click data meaningfully stronger than passive metrics like cursor movement or time-on-page.
Sampling and retention matter more than most teams realise. Vendors typically store a sample of sessions rather than every event, and retention windows vary from 30 days to 12 months depending on the plan. Short windows can skew results if you have seasonal traffic spikes.
Dynamic content and single-page applications (SPAs) create a specific capture problem. When the DOM updates without a full page reload, a basic tracking script may log clicks against the wrong element or a stale coordinate. The result is a misleading overlay.
Pro Tip: Ask any vendor whether their script uses mutation observers and element anchors (not just X/Y coordinates) to track clicks on dynamically rendered content. If the answer is no, your SPA data will be unreliable.
How do click maps compare to scroll maps and session replay?
Each visualisation answers a different question, and choosing the wrong one wastes time.
| Tool | Primary question answered | Strength | Limitation |
|---|---|---|---|
| Click map | Where do users interact? | Precise intent signal per element | No context for why they clicked |
| Scroll map | How far down do users read? | Reveals content visibility | No interaction data |
| Move/attention map | Where do eyes and cursor linger? | Approximates reading patterns | Cursor ≠ gaze on mobile |
| Session replay | What did one user actually do? | Full context and sequence | Time-intensive; not aggregate |
The most efficient diagnostic workflow is: start with a scroll map to confirm that users are actually seeing the content in question, then switch to a click map to check whether they engage with it. If content is visible but not clicked, the problem is messaging or CTA design, not placement. Reserve session replay for outlier sessions that the aggregate data cannot explain.
Click maps are the priority tool when you are optimising CTAs, navigation menus, or any clickable element. Scroll maps take priority when you are evaluating content length or above-the-fold decisions.
How do you set up click maps step by step?
Getting from zero to a usable overlay takes less than an hour for most sites.
- Select your pages. Start with high-traffic pages and key funnel steps, homepage, product pages, checkout entry. Avoid low-traffic pages until you have baseline data.
- Add the vendor script. Paste the tracking snippet into your site's
<head>tag or deploy via Google Tag Manager. For Microsoft Clarity, the setup wizard generates a one-line snippet. - Verify event capture. Use the vendor's live view or browser developer tools to confirm clicks are being recorded before you leave the setup screen.
- Set your date range and sample target. Aim for a minimum of two weeks and at least 500 sessions per device segment before drawing conclusions.
- Test on desktop and mobile separately. Open the overlay on both device views and confirm that the segmentation is working correctly.
- Segment by traffic source. Paid and organic visitors often behave differently on the same page. Mixing them can obscure which audience has the friction problem.
Setup checklist before going live:
- Consent banner is active and click tracking fires only after consent (required under POPIA).
- Staging environment is excluded from the live dataset.
- Dynamic content pages are tested for correct element attribution.
- Data retention is set to the shortest period that meets your analysis needs.
Pro Tip: After making a change suggested by your click map, set up a simple A/B test: Hypothesis → "Moving the CTA into the banner zone will increase clicks by X%." KPI → CTA click rate and downstream conversion rate. Run for two full weeks or until you reach statistical significance.
Which click-map tools work for South African teams?
All three tools below are accessible from South Africa with no regional restrictions, though data hosting locations vary and should be reviewed against your POPIA obligations.
- Microsoft Clarity, free, with no session or pageview limits. Provides click maps, scroll maps, and session replays in one dashboard. Best for teams that need a solid baseline without a budget line. Data is hosted on Microsoft Azure; review the data processing agreement for POPIA purposes.
- Hotjar, widely used for its ease of setup and qualitative features (polls, surveys, feedback widgets alongside heatmaps). Paid plans start in USD; convert to ZAR at the current exchange rate. Well-suited to UX teams running qualitative research alongside quantitative overlays.
- Contentsquare, enterprise behavioural analytics platform that positions click maps inside a broader suite covering zone-based analytics, journey analysis, and revenue attribution. Pricing is enterprise-negotiated. Best for large South African e-commerce or financial services sites with high traffic volumes and complex funnels.
For teams that want a lightweight, open-source option, self-hosted tools exist but require developer time to maintain and may lack the POPIA-friendly anonymisation controls that the commercial tools provide out of the box.
How do you interpret results and what should you do next?
Reading a click map without a structured process leads to cherry-picking the most dramatic hotspot and ignoring the rest. Use this checklist every time.
- Verify that the sample meets your minimum threshold (500+ sessions per device).
- Segment by device, review desktop and mobile overlays separately.
- Identify non-clickable hotspots and list the elements by click volume.
- Check rage-click locations against your error logs.
- Prioritise fixes by business impact: a dead click on the checkout CTA outranks one on a footer logo.
- Build an experiment plan for each change before touching the live site.
A/B test template:
| Column | Description |
|---|---|
| Hypothesis | "Making the product image clickable will increase add-to-cart rate." |
| KPI | Add-to-cart click rate; downstream purchase conversion rate |
| Sample size estimate | Minimum 500 sessions per variant per device |
| Duration | Two full weeks minimum |
| Success criteria | Statistically significant lift in KPI |
Pro Tip: Always track downstream conversions, not only click rate. A CTA that gets more clicks but fewer purchases has not improved your business, it has just moved the friction point one step further down the conversion funnel.
Pairing click-map findings with AI-assisted analytics can speed up pattern recognition across large datasets, particularly for enterprise sites with dozens of page templates.
Privacy, POPIA compliance and ethical data handling
Click events can constitute personal data under POPIA when they are linked to an identifiable user session or device. South African site owners must treat click-map implementation as a data processing activity, not a passive analytics add-on.
POPIA compliance checklist:
- Determine whether your click-capture setup records data that could identify an individual (session IDs, IP addresses, user account context).
- Implement a consent banner that gates click tracking behind explicit opt-in, or document a legitimate interest basis with a balancing test.
- Record your lawful basis in your data processing register.
- Set retention to the shortest period that meets your analysis needs, 30 to 90 days covers most CRO cycles.
- Enable vendor-side IP anonymisation and mask any form fields that capture personal data.
- Review the vendor's data processing addendum (DPA) and confirm where data is hosted and how deletion requests are handled.
For a South African CRO checklist that includes POPIA-specific steps, Juicydesigns has published a dedicated resource.
Pro Tip: Prefer aggregated overlay views for day-to-day analysis and disable precise pixel-level session replay storage unless you have a specific debugging need. Aggregated data carries far lower POPIA risk than individual session recordings.
Key Takeaways
Click map analytics gives you the fastest visual evidence of where users interact and where they get stuck, making it the most direct input for CRO decisions on South African websites.
| Point | Details |
|---|---|
| Core definition | A click map is a colour-coded overlay that aggregates click and tap events to show interaction patterns across a page. |
| Top use cases | CTA optimisation and dead-click detection are the two highest-impact applications for most marketing teams. |
| Sample size and timing | Collect at least 500 sessions per device type over a minimum two-week window before acting on results. |
| POPIA obligation | Click capture is a data processing activity under POPIA; consent, anonymisation, and short retention periods are required. |
| Juicydesigns approach | Juicydesigns runs device-segmented click-map audits as part of its CRO engagements for South African businesses. |
The gap between what click maps promise and what teams actually do with them
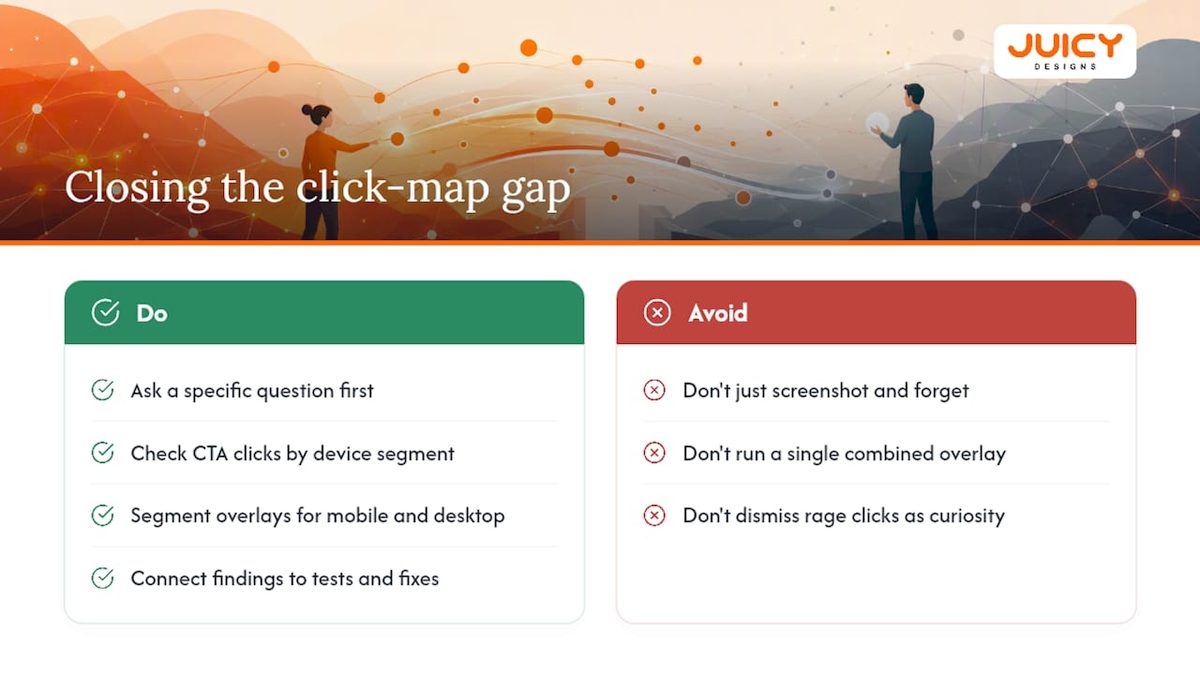
Most teams install a click-map tool, look at the pretty heatmap once, and then never act on it. The overlay becomes a dashboard widget that gets screenshotted for a presentation and forgotten. That is not a tool problem, it is a workflow problem.
The real value of click map analytics is not the visual itself. It is the discipline of asking a specific question before you open the overlay: "Is our primary CTA getting clicked, and by which device segment?" Without that question, you are just looking at colours. With it, you have a diagnostic framework that connects directly to a test, a fix, and a measurable outcome.
South African sites face an additional layer of complexity because the device mix here skews heavily mobile, and mobile click behaviour is genuinely different from desktop. A CTA that performs well on desktop may be completely outside the thumb-reach zone on a mid-range Android device, the dominant handset category in this market. Teams that run a single combined overlay miss this entirely.
The other underrated application is rage-click monitoring. Most teams treat rage clicks as a curiosity. They are actually one of the most reliable early-warning signals for broken functionality, and catching a broken checkout button via rage-click data before your support inbox fills up is worth more than any A/B test.
Juicydesigns handles click-map setup, analysis and POPIA-safe implementation
If your team has the data but not the bandwidth to act on it, Juicydesigns offers hands-on click-map audits, CRO test planning, and POPIA-compliant implementation for South African businesses. Every engagement is founder-led, priced in ZAR, and structured around your specific funnel, no long-term contracts, no agency overhead.
The process starts with a digital audit that identifies your highest-friction pages, followed by a click-map setup and a two-week observation window. From there, Juicydesigns builds a prioritised test plan with clear KPIs and handles the A/B testing through to statistical significance. For small businesses, the small business digital marketing service includes click-map analysis as part of a broader CRO package. Get a quote at juicydesigns.co.za and find out what your pages are actually telling you.
Useful sources
- Click Maps: Track User Clicks on Your Website in 2026
- Clarity click maps , what can they do for you?
- learn.microsoft.com
- A Complete Guide To Click Heatmaps: How They Work and Why They Matter | VWO
- What is a click map? Definition, Omniconvert
- statista.com
FAQ
What is a click map?
A click map is a visual overlay placed on a webpage screenshot that shows where users click or tap, using colour gradients or numbered labels to indicate interaction density. It aggregates data from many sessions into a single, readable pattern.
What is click analytics?
Click analytics is the broader practice of collecting, aggregating, and interpreting user click and tap events on a website to understand interaction behaviour and identify friction points. Click maps are the primary visual output of click analytics.
What is a heatmap and why is it used?
A heatmap is a colour-coded data visualisation that represents the intensity of user interactions across a webpage, covering clicks, cursor movement, or scroll depth. Marketers use heatmaps to quickly identify which page areas attract attention and which are ignored, without needing to write complex queries.
Does Google Analytics track clicks?
Google Analytics tracks clicks on outbound links and file downloads by default, but it does not produce visual click overlays. For element-level click maps and heatmaps, a dedicated tool like Microsoft Clarity, Hotjar, or Contentsquare is required alongside Google Analytics.
How do you stay POPIA-compliant when using click maps in South Africa?
Gate click tracking behind a consent banner, enable IP anonymisation in your vendor settings, document your lawful basis for processing, and set data retention to 30-90 days. Review your vendor's data processing addendum to confirm where session data is hosted and how deletion requests are handled.
Recommended
- Heatmaps: Find Why Visitors Don't Convert | Juicy Designs
- Marketing Analytics & Reporting South Africa | Juicy Designs
- Content Marketing ROI: How to Measure It | Juicy Designs
- Why digital marketing ROI is measurable: a 2026 guide