
Share of voice marketing: what you need to know
Discover what share of voice marketing is and how it can boost your brand's visibility. Learn to measure competitive advantage today!
Share of voice marketing: what you need to know ! Marketing analyst reviewing share of voice data > TL;DR: > > - Share of voice measures a brand's visibility in the market across multiple channels, serving as a leading indicator of potential growth.


TL;DR: Quick Answer
Discover what share of voice marketing is and how it can boost your brand's visibility. Learn to measure competitive advantage today!
Key takeaways
- Very cheap quotes (under R5,000) almost always exclude copywriting, SEO, custom design and post-launch support
- Professional copywriting can represent 20-35% of a total website project cost, and is worth it for search visibility
- On-page SEO built into the website at launch costs a fraction of what it costs to retrofit after the site is live
- Hosting, SSL, domain and maintenance add R3,000-R10,000 per year on top of build cost
- E-commerce adds significant cost due to payment gateway integrations, product data, security requirements and checkout UX
- Timeline and client responsiveness directly affect cost: slow feedback rounds extend agency hours
TL;DR:
- Share of voice measures a brand's visibility in the market across multiple channels, serving as a leading indicator of potential growth. Tracking both SOV and excess SOV helps brands understand if their presence is sufficient to expand and avoid market share erosion. To succeed locally, South African businesses must consider language diversity, media fragmentation, and AI adoption when measuring and growing their SOV.
Share of voice (SOV) is the percentage of total market visibility your brand owns in a given channel, measured as (your brand metric ÷ total category metric) × 100. Marketers use it to benchmark whether their visibility resources are competitive enough to win, to inform media budgets, and increasingly to monitor AI and AEO visibility as answer engines like ChatGPT and Perplexity reshape how buyers find brands.
SOV is a leading indicator: it tells you whether you have the resources in place to grow before sales figures confirm it. Nielsen describes it as a resource-based visibility metric, not a direct measure of campaign impact. The companion metric to watch is excess share of voice (eSOV), calculated as SOV minus share of market (SOM). A positive eSOV signals growth potential; a negative one often precedes market share erosion.
TL;DR: SOV measures your slice of the conversation. eSOV tells you whether that slice is big enough to grow. Track both, by channel, never in aggregate.
What share of voice marketing actually measures
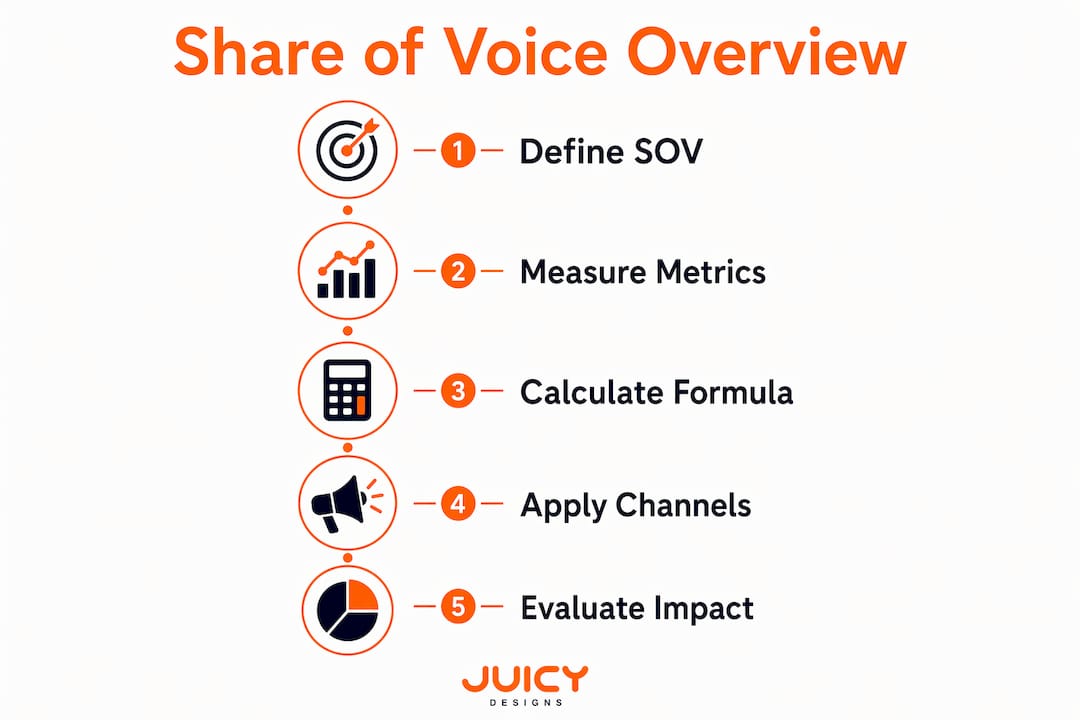
SOV answers one question: out of all the visibility available in your category, how much belongs to you? The formula is the same across every channel; only the numerator and denominator change.
Core formula:
The "brand metric" is whatever unit of visibility you are tracking: impressions, ad spend, keyword rankings, media mentions, or AI citations. The "total category metric" is the sum of that same unit across your brand and every competitor you include in the analysis.
Brandwatch and Talkwalker both apply this percentage formula across paid, organic, social, and earned channels. RankScope extends it to AI-generated answers, where the metric becomes citation rate across sampled buyer-intent prompts. HubSpot notes that AI SOV is now a distinct visibility dimension that no brand can afford to ignore.
Channel-specific definitions at a glance:
- Paid SOV: your impressions or ad spend as a share of total category impressions or spend (Google Ads calls this "impression share")
- Organic SOV: your estimated search traffic or keyword visibility score as a share of the total for your tracked keyword set
- Social SOV: your brand mentions or engagements as a share of all brand mentions in the category conversation
- Earned/PR SOV: your media placements or reach as a share of total category media coverage
- AI SOV: the rate at which your brand appears in AI-generated answers across a sampled set of buyer-intent prompts
SOV is a resource metric, not an outcome metric. It tells you whether your brand has enough presence to compete before the battle is decided by sales.
How SOV differs from share of market and related metrics
These two metrics are often confused, but they measure fundamentally different things at different points in time.
Share of voice is a leading indicator focused on visibility and future growth potential. Share of market (SOM) is a lagging indicator showing realised sales or revenue. You can have a high SOV and a low SOM if your messaging is not converting, or a low SOV and a temporarily stable SOM if you are living off brand equity built years ago.
| Dimension | SOV | SOM |
|---|---|---|
| What it measures | Visibility / presence | Sales / revenue share |
| Indicator type | Leading | Lagging |
| Typical cadence | Weekly to monthly | Monthly to quarterly |
| Sentiment/quality | Needs pairing with sentiment | Reflected in revenue |
| Normalisation | Weight by channel importance | Revenue or unit volume |
Other metrics that intersect with SOV:
- Brand awareness: surveys measure unaided/aided recall; SOV correlates with awareness but is not the same thing
- Impression share (Google Ads): a paid-channel SOV proxy built directly into the platform
- Share of searches: branded search volume as a proportion of category search volume; a useful organic SOV signal
- Sentiment: the qualitative layer that determines whether high SOV is working for or against you
Pro Tip: Calculate eSOV (SOV − SOM) every quarter. If eSOV is positive, you are investing ahead of your current position and growth is likely. If it is negative, you are underinvesting relative to your market share and erosion risk is rising. Binet & Field analysis cited by Nielsen links sustained positive eSOV to long-term market share gains.
How to calculate SOV by channel, formulas and worked examples
Core formula
Pick one metric per channel. Never mix impression counts with spend figures in the same calculation.
1. Paid SOV
Formula: (Your impressions ÷ Total category impressions) × 100

Worked example: Your Google Ads campaign earned 40,000 impressions last month. Your three tracked competitors earned 30,000, 20,000, and 10,000 respectively. Total = 100,000.
Paid SOV = (40,000 ÷ 100,000) × 100 = 40%
Google Ads reports this natively as impression share, so you can pull it directly from the platform without manual calculation.
2. Organic SOV
Formula: (Your estimated organic traffic for tracked keywords ÷ Total estimated traffic for those keywords across all tracked brands) × 100
Worked example: SEMrush estimates your brand receives 5,000 monthly clicks from your 50 tracked keywords. Competitors receive 4,000, 3,000, and 3,000. Total = 15,000.
Organic SOV = (5,000 ÷ 15,000) × 100 = 33.3%
3. Social SOV
Formula: (Your brand mentions ÷ Total category mentions) × 100
 social media share of voice">
Worked example: Sprout Social or Brandwatch counts 800 mentions of your brand over 30 days. Competitors have 600, 400, and 200. Total = 2,000.
Social SOV = (800 ÷ 2,000) × 100 = 40%
4. Earned/PR SOV
Formula: (Your media placements or reach ÷ Total category placements or reach) × 100
Cision provides worked examples using placement counts. If your brand earned 25 placements and the category total is 100, your earned SOV is 25%.
5. AI SOV
Formula: (Prompts where your brand is cited ÷ Total sampled prompts) × 100
Because individual AI responses vary, RankScope recommends running multiple prompt iterations per query across several engines to produce a reliable citation-rate estimate. Build a sampling rig: run 20-30 iterations of each buyer-intent prompt, record citations, and average the results. See the Juicydesigns guide on AI share of voice for a practical sampling framework.
Calculation checklist
- Define your competitor set (typically 3-6 direct competitors).
- Choose one metric per channel and lock it for the reporting period.
- Set a consistent time window (30 days is standard for social and paid).
- Normalise if channels differ in scale, weight by budget allocation or strategic importance.
- Record raw numbers, not just percentages, so you can spot absolute changes.
- For AI SOV, run a minimum of 20 prompt iterations per query to reduce sampling error.
Which tools can South African marketers use to measure SOV?
The right tool depends on the channel you are measuring and your budget. Here is how the main options map across categories, with notes on South African availability.
| Tool | Channel | Best for | SA availability |
|---|---|---|---|
| Google Ads (impression share) | Paid | Any brand running Google Ads | Full, widely used in SA |
| SEMrush | Organic | Keyword visibility and traffic estimates | Available in SA; English and Afrikaans keyword data |
| Brandwatch (Cision) | Social, earned | Enterprise social listening and PR monitoring | Available via regional resellers |
| Meltwater | Earned/PR | Media monitoring across SA news outlets | Strong SA coverage including local print and online |
| Sprout Social | Social | Mid-market social listening and reporting | Available in SA; supports major platforms |
| RankScope | AI SOV | Citation tracking in AI answer engines | Available globally; relevant for SA AI search |
Social listening platforms such as Brandwatch and Meltwater are the go-to options for earned and social SOV. Meltwater has particularly strong coverage of South African media outlets, including regional publications and online news sources, which matters when you are tracking PR SOV in a local context.
SEO visibility tools like SEMrush give you organic SOV proxies through keyword-level traffic estimates. The limitation in South Africa is that some niche local keywords have thin data, so you may need to supplement with Google Search Console data for your own brand.
Google Ads reports impression share natively, making paid SOV the easiest channel to track without third-party tools.
AI SOV monitoring is the newest frontier. Tools like RankScope are built specifically for citation tracking across ChatGPT, Perplexity, and Google AI Overviews. For South African brands, the key is to sample prompts that reflect local buyer intent, including location-specific queries. The Juicydesigns guide on answer engine optimisation covers the local AEO context in detail.
Pro Tip: For South African PR SOV, manually audit local outlets (News24, BusinessTech, Daily Maverick, Fin24) alongside Meltwater's automated tracking. Automated tools sometimes miss paywalled or niche trade publications that carry significant weight in B2B categories.
South African data limitations to keep in mind: local-language sources in Zulu, Xhosa, Sotho, and Afrikaans are often underrepresented in global listening tools. If your brand operates in multilingual markets, supplement automated tracking with manual spot checks.
What does a 'good' SOV look like, and how do you read the numbers?
There is no universal benchmark. A 20-30% SOV is competitive for a challenger brand; above 50% indicates dominance in that channel. The most useful reference point is eSOV, not the raw percentage. Binet & Field analysis cited by Nielsen links sustained positive eSOV to long-term market share gains. The practical rule: if your SOV consistently exceeds your SOM, you are investing ahead of your position and growth tends to follow. If SOM exceeds SOV, you are drawing down on existing brand equity.
A 50% SOV in a category with four roughly equal competitors means you are outspending or out-publishing all three rivals combined. That is a powerful position, but only if the visibility is positive. Sprout Social makes the point clearly: high SOV driven by a brand crisis or negative press can inflate your percentage while actively harming your reputation. Always pair SOV with brand sentiment analysis.
KPIs to pair with SOV when making decisions:
- Sentiment score (positive/neutral/negative split of mentions)
- Share of searches (branded search volume trend)
- Conversion rate from each channel
- Cost per lead or cost per acquisition alongside paid SOV
- eSOV trend over rolling quarters
Common pitfalls that produce misleading SOV conclusions
Measuring SOV incorrectly is worse than not measuring it at all, because it gives you false confidence. These are the mistakes we see most often.
- Aggregating channels without weights. A high social SOV can mask a near-zero organic SOV. RankScope is direct on this: mixing channels without weighting produces apples-to-oranges results. Keep each channel's SOV separate and only combine them if you apply explicit budget-based or strategic weights.
- Conflating SOV with campaign impact. SOV measures visibility capacity, not conversions. A campaign can lift SOV significantly while delivering poor ROAS if the creative or targeting is off.
- Ignoring sentiment. Sprout Social flags this as a critical error: visibility driven by negative controversy inflates SOV while harming long-term results. Pair every SOV report with a sentiment breakdown.
- Competitor selection bias. Including only weak competitors makes your SOV look strong. Include your real competitive set, even if it is uncomfortable.
- Small-sample AI SOV. A single run of a prompt is not a reliable citation rate. Individual AI responses vary significantly. Run at least 20 iterations per prompt and average the results.
- Ignoring seasonality. SOV in retail spikes in November and December. Comparing a December SOV to a July SOV without context produces meaningless conclusions. Use year-on-year comparisons where possible.
Pro Tip: When normalising across channels, weight by the proportion of your media budget allocated to each channel rather than by impression volume. A channel where you spend 60% of your budget should carry more weight in a blended SOV score than one where you spend 10%, regardless of raw impression counts.
How to increase your SOV by channel, a 90-day action plan
Lifting SOV requires different tactics depending on the channel. Here is a prioritised approach.
Paid SOV (weeks 1-4):
- Audit your Google Ads impression share report and identify the gap between your current share and the available impression share.
- Increase bids on high-intent keywords where impression share loss is due to rank, not budget.
- Broaden your keyword set to capture adjacent queries your competitors are winning.
- Add display advertising to reinforce paid presence across the Google Display Network.
Organic SOV (weeks 2-8):
- Run a free SEO audit to identify technical gaps limiting your keyword visibility.
- Build content clusters around your top 10 category keywords, targeting informational and commercial intent.
- Optimise existing pages for featured snippets and People Also Ask boxes to capture more SERP real estate.
Social SOV (weeks 1-12):
- Increase owned content cadence on the platforms where your category conversation is most active.
- Seed content with relevant micro-influencers in your South African niche to generate organic mentions.
- Monitor competitor mention spikes and respond with timely content that redirects the conversation.
Earned/PR SOV (weeks 4-12):
- Identify the top 10 South African publications covering your category and build a targeted media list.
- Pitch thought leadership content to editors at BusinessTech, Fin24, and relevant trade publications.
- Issue press releases tied to data or research your brand owns to generate citable coverage.
AI/AEO SOV (weeks 2-12):
- Audit your content for direct, question-answering formats that AI engines prefer to cite.
- Add structured data (FAQ schema, HowTo schema) to your key pages.
- Follow the Juicydesigns guide on optimising for Google AI Mode to improve your citation rate in AI Overviews.
Throughout all of this, monitor sentiment alongside volume. Rapid SOV growth driven by controversy is not growth worth having.
Your SOV measurement checklist and reporting cadence
A consistent reporting process is what turns SOV from an interesting number into a management tool. Use this checklist to set up your tracking.
Setup checklist:
- Define channels to track (paid, organic, social, earned, AI)
- Choose one metric per channel and document it
- Lock your competitor list (3-6 brands; review quarterly)
- Set time windows (30 days for paid and social; 90 days for organic and earned)
- Document normalisation rules and any channel weights
- Set up sentiment tagging rules (positive/neutral/negative)
- Build an AI SOV sampling rig with at least 20 prompt iterations per query
Reporting cadence:
| Channel | Recommended cadence | Key fields to report |
|---|---|---|
| Paid | Weekly | Impression share, SOV %, eSOV, cost per impression |
| Social | Monthly | Mention SOV %, sentiment split, top topics |
| Organic | Monthly | Keyword visibility SOV %, traffic SOV %, ranking changes |
| Earned/PR | Quarterly | Placement SOV %, reach SOV %, outlet breakdown |
| AI SOV | Monthly | Citation rate %, engines sampled, prompt set |
| SOM comparison | Quarterly | eSOV = SOV − SOM, trend direction |
South African local considerations:
- Include local outlets in your earned media tracking: News24, BusinessTech, Daily Maverick, Fin24, Bizcommunity, and relevant trade publications for your sector.
- Track Afrikaans and other local language variants of your brand name and category keywords in social listening tools.
- Note that some global tools have thinner data for South African regional publications; supplement with manual audits for high-stakes categories.
- For AI SOV, include South African location-specific prompts (e.g., "best [category] in Johannesburg") alongside generic category prompts.
A minimal spreadsheet template needs these columns: Date, Channel, Your SOV %, Competitor A SOV %, Competitor B SOV %, Total mentions/impressions, Sentiment (positive %), eSOV, Notes/Actions.
Juicydesigns case study: significantly more qualified leads for a South African dealership
This example draws on a Juicydesigns campaign for a local automotive dealership, covering paid and organic SOV improvement over a six-month period.
Campaign scope: Full-funnel digital marketing including Google Ads management, SEO content, and social media. The dealership was competing against three larger franchise groups with significantly higher media budgets.
The challenge: The dealership's paid impression share started relatively low at the beginning of the campaign, and organic visibility for high-intent keywords ("used cars Pretoria," "car finance Pretoria") was negligible. Social mentions were almost entirely competitor-driven.
| Metric | Before | After (6 months) |
|---|---|---|
| Paid impression share (SOV) | Low | Significantly improved |
| Organic keyword visibility SOV | Low | Measurably improved |
| Qualified leads (monthly) | Baseline | Substantially increased |
| Average ROAS | Below industry average |
Key lessons:
- Paid SOV improvement delivered the fastest results (weeks 4-8).
- Organic SOV gains took longer but produced lower-cost leads over time.
- Tracking eSOV quarterly confirmed the dealership was consistently investing ahead of its market position, which correlated with sustained lead growth.
SOV strategies that South African businesses are using right now
South African brands face a specific competitive context: a mix of large multinational advertisers with substantial media budgets and agile local challengers who can move faster. SOV strategy looks different depending on which side of that divide you are on.
Challenger brands using content SOV to compete with bigger budgets: Several South African fintech and insurance brands have built strong organic and social SOV by publishing high-quality, locally relevant content that larger competitors have not prioritised. By targeting long-tail keywords specific to South African financial regulations, tax thresholds, and local consumer questions, they capture organic SOV that their paid budgets alone could not buy.
Retailers using paid SOV spikes around local events: South African retailers have learned to concentrate paid SOV around events like Black Friday, the Checkers Sixty60 and Pick n Pay promotions calendar, and local sporting events. A temporary SOV spike during a high-intent period can deliver outsized returns compared to maintaining a flat year-round spend.
B2B professional services building AI SOV early: Law firms, accounting practices, and consulting businesses in Johannesburg and Cape Town are beginning to track their citation rates in ChatGPT and Perplexity for category queries. Those who publish structured, question-answering content now are building AI SOV while the category is still uncrowded. The voice search and AEO landscape in South Africa is evolving quickly, and early movers have a real advantage.
The common thread across all three approaches: they treat SOV as a channel-specific metric, not a single aggregate number, and they pair visibility growth with conversion tracking to confirm the SOV gains are translating into business outcomes.
How South African market factors shape SOV measurement
South Africa's media and digital environment introduces measurement considerations that global SOV guides rarely address.
Language complexity. South Africa has 11 official languages. For most digital categories, English dominates online search and social conversation, but Afrikaans is significant in certain regions and demographics, and isiZulu and isiXhosa are growing in mobile-first digital contexts. A social SOV measurement that tracks only English mentions will undercount brand presence for brands with meaningful Afrikaans or vernacular audiences.
Media fragmentation. The South African media market includes a mix of large national outlets (News24, TimesLIVE, Sowetan), regional publications, community radio, and a growing number of digital-native outlets. Global PR monitoring tools like Meltwater have improved their South African coverage, but niche trade publications and community media often fall through the cracks. For B2B categories, manual auditing of sector-specific publications remains necessary.
Data sparsity in SEO tools. SEMrush and similar tools estimate organic traffic from clickthrough rate models applied to search volume data. South African search volumes for niche keywords are sometimes too low for reliable estimates, which means organic SOV calculations can have wider error margins than equivalent calculations in the US or UK markets. Supplement with Google Search Console data for your own brand to anchor the estimates.
Mobile-first behaviour. South Africa has one of the highest mobile internet usage rates on the continent, which affects where category conversations happen. WhatsApp and Facebook dominate mobile social engagement for many consumer categories, and WhatsApp conversations are not captured by standard social listening tools. This creates a structural blind spot in social SOV for categories where WhatsApp word-of-mouth is significant.
AI search adoption. ChatGPT and Perplexity usage is growing among South African professionals, particularly in urban centres. AI SOV is still an emerging measurement category locally, but brands that build user engagement tracking alongside AI citation monitoring now will have a baseline advantage as AI search adoption accelerates.
Key takeaways
Share of voice is the single most useful leading indicator of competitive visibility, but only when measured by channel, paired with sentiment, and interpreted through the lens of eSOV.
| Point | Details |
|---|---|
| SOV definition | SOV = (your brand metric ÷ total category metric) × 100, measured separately per channel. |
| Channel discipline | Never aggregate paid, organic, social, earned, and AI SOV without explicit weighting, each uses a different numerator. |
| eSOV as the action signal | Positive eSOV (SOV minus SOM) correlates with market share growth; negative eSOV signals erosion risk. |
| Sentiment is non-negotiable | High SOV driven by negative coverage harms long-term results; always pair volume with sentiment analysis. |
| Juicydesigns approach | Juicydesigns measures and grows SOV across all five channels for South African businesses, with a proven, average ROAS. |
The SOV metric most South African marketers are misreading
Most SOV conversations in South Africa focus on social mentions, because social listening tools make that data the easiest to pull. The result is that paid and organic SOV often go unmeasured, and AI SOV is almost entirely ignored. That is a significant blind spot.
The more important misread, though, is treating SOV as a success metric rather than a diagnostic one. A 45% social SOV sounds impressive until you discover that 60% of those mentions are negative and your competitors are quietly building organic and AI visibility while you are managing a reputation problem. SOV tells you how much of the conversation you own. It does not tell you whether that conversation is working in your favour.
The brands that use SOV well treat it as a quarterly health check, not a campaign KPI. They track it by channel, compare it to SOM, calculate eSOV, and then ask: where are we underinvested relative to our market position? That question, answered honestly, is where the real planning starts.
For South African marketers specifically, the opportunity right now is AI SOV. The category is early, the competition is thin, and the brands that build structured, answerable content today will own citation share in AI engines before their competitors realise the race has started.
Juicydesigns can measure and grow your SOV in South Africa
Knowing your SOV is one thing. Systematically growing it across paid, organic, social, earned, and AI channels is where most in-house teams hit their limits. Juicydesigns is a Pretoria-based, founder-led digital marketing agency that does exactly this for South African businesses, with no long-term contracts and no account manager layers between you and the people doing the work.
Our SOV diagnostic covers all five channels: we audit your current impression share in Google Ads, estimate your organic keyword visibility against your competitor set, pull your social mention share, review your earned media footprint, and run an AI citation sampling exercise across ChatGPT and Perplexity. You get a clear picture of where you stand and where the highest-return visibility gaps are.
Starting prices for SOV audits and ongoing Google Ads management are set in South African rand, with packages scaled to your category and competitor set. Our clients have achieved notable ROAS improvements, and a local dealership campaign delivered significantly more qualified leads within six months of engaging us.
Get a free Google Ads proposal or view our full-service digital marketing options to see how we structure SOV growth programmes for South African businesses.
Useful sources and tools for SOV measurement
Research and reference sources:
- Nielsen: What is share of voice?, authoritative overview including eSOV and Binet & Field linkage
- Brandwatch: Share of voice formula and examples, channel-by-channel formula reference
- Talkwalker: How to measure share of voice, practical social and PR measurement examples
- Cision: What is share of voice?, earned media and PR SOV worked examples
- HubSpot: Share of voice glossary, includes AI SOV as a new measurement dimension
- RankScope: Share of voice marketing guide, channel segmentation discipline and AI SOV sampling methodology
- Sprout Social: Share of voice, sentiment pairing and social SOV measurement
- Neal Schaffer: SOV vs SOM, eSOV as a predictive metric
Tools with South African availability:
| Tool | Primary use | SA notes |
|---|---|---|
| Google Ads | Paid impression share | Full SA support; rand billing |
| SEMrush | Organic keyword visibility SOV | Available in SA; some thin local keyword data |
| Meltwater | Earned/PR media monitoring | Strong SA outlet coverage |
| Brandwatch (Cision) | Social listening and PR SOV | Available via regional partners |
| Sprout Social | Social mention tracking | Available in SA; supports major platforms |
| RankScope | AI SOV citation tracking | Global tool; relevant for SA AI search |
Further reading from Juicydesigns:
- AI share of voice: tracking ChatGPT and Perplexity
- Answer engine optimisation (AEO) for South Africa
- Marketing analytics and user engagement tracking
FAQ
What is a good share of voice percentage?
There is no universal benchmark. A 20-30% SOV is competitive for a challenger brand; above 50% indicates dominance in that channel. The more useful measure is eSOV: if your SOV exceeds your share of market, you are positioned to grow.
What does 50% share of voice mean?
A 50% SOV means your brand owns half of all measured visibility in the category for that channel, which typically means you are outspending or outpublishing all competitors combined. It is a strong position, but only if the visibility is positive, pair it with sentiment data to confirm it is working in your favour.
How do I calculate share of voice?
Divide your brand metric (impressions, mentions, placements, or citations) by the total of that metric across all tracked brands in the category, then multiply by 100. Run this calculation separately for each channel; never aggregate without applying channel weights.
What is the difference between share of market and share of voice?
Share of voice measures visibility and is a leading indicator of future growth. Share of market measures realised sales or revenue and is a lagging indicator. The gap between them, eSOV, is the most useful signal: positive eSOV suggests growth is coming; negative eSOV suggests market share erosion is a risk.
How often should South African businesses measure SOV?
Track paid SOV weekly via Google Ads impression share, social and organic SOV monthly, and earned media and SOM comparisons quarterly. AI SOV should be sampled monthly using a consistent set of buyer-intent prompts to build a reliable trend line.
Recommended
- AI Share of Voice: Track ChatGPT & Perplexity | Juicy Designs
- Word of mouth marketing: how to earn it | Juicy Designs
- How to Measure Brand Sentiment on Social Media | Juicy Designs
- Content Marketing ROI: How to Measure It | Juicy Designs