
Turn 6.6% Into More Conversions: Landing Page Conversion Benchmarks and 6 Fixes
Landing page benchmarks decoded. Learn why 6.6% is the median, how traffic and industry change targets, and six fixes to lift conversions.
Turn 6. 6% Into More Conversions: Landing Page Conversion Benchmarks and 6 Fixes !


TL;DR: Quick Answer
Landing page benchmarks decoded. Learn why 6.6% is the median, how traffic and industry change targets, and six fixes to lift conversions.
A healthy landing page conversion rate sits in the mid single digits, around 6% to 7% at the median. Your real target shifts with industry, traffic source, and what you're asking visitors to do, so treat any single number as a starting line, not a finish line.
TL;DR:
- Conversion rates vary significantly by traffic source, with email often reaching mid teens and paid social averaging much lower, affecting what is considered "good."
- Industry benchmarks show median conversion rates around 6.6%, but performance expectations should be aligned with traffic warmth and campaign specifics.
- For underperforming pages below 3%, issues likely include poor messaging, load speed, or lack of trust signals, requiring targeted fixes.
- Improving load speed on mobile and reducing form fields are among the most effective ways to boost conversion rates, especially on mobile devices.
- Top agencies typically fix high-impact issues like headlines, social proof, CTA clarity, and load speed within four to six weeks, rather than relying solely on DIY testing.
What are the current landing page conversion rate benchmarks?
The most cited figure in the industry comes from Unbounce's conversion benchmark report, which pulled data from more than 41,000 landing pages and over 57 million conversions. The all-industry median is 6.6%.
That word "median" matters more than most marketers realise. Unbounce reports the median rather than the mean because a handful of extreme outliers, a viral campaign here, a botched tracking setup there, can drag an average wildly off course. Median tells you what the typical page actually does, which is far more useful when you're trying to judge your own performance against reality rather than a statistical fluke.
Here's how to read the spread, based on the ranges Unbounce and PageStrike both describe:
- Under 3%: Underperforming. Something is broken, whether that's messaging, targeting, load speed, or trust.
- 3% to 7%: Typical. This is where most landing pages sit, and it's a perfectly respectable place to be.
- 7% to 12%: Strong. You're outperforming most of your industry.
- 12% and above: Elite. Usually driven by warm traffic, a highly specific offer, or both.
Trust signal: A dataset of 41,000+ pages and 57 million conversions gives this median real statistical weight. Smaller benchmark studies (a few hundred pages) can swing wildly depending on which industries or campaigns happen to be included, so the size of the sample behind a number is worth checking before you anchor your goals to it.
One caveat worth internalising early: these bands describe the landing page ecosystem as a whole. A page pulling 4% from cold paid social traffic might be performing brilliantly, while a page pulling 4% from a warm email list is underperforming badly. Context, not the raw percentage, tells you whether to celebrate or fix something.
How do conversion benchmarks change by industry and CTA type?
Comparing your ecommerce checkout page to a SaaS demo request page is like comparing a sprinter's time to a marathoner's, the goals, the buyer psychology, and the friction points are completely different. Benchmarks only mean something when you compare like-for-like.
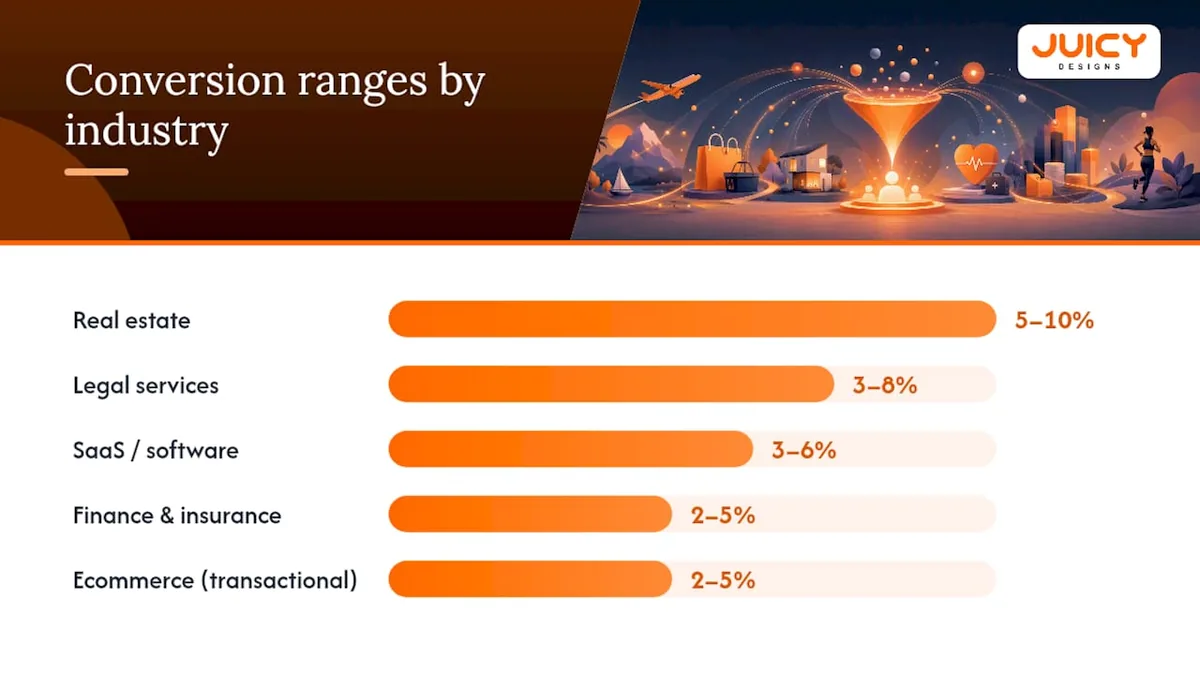
Industry ranges tend to cluster like this, based on patterns across Unbounce and Leadpages benchmark analyses:
- SaaS and software: Often in the 3% to 6% range for free trial or demo pages, since the ask carries more commitment.
- Finance and insurance: Tends to run lower, frequently 2% to 5%, because of higher stakes and longer decision cycles.
- Ecommerce: Varies enormously by price point, but transactional pages commonly sit between 2% and 5% for direct purchases.
- Legal services: Consultation request pages often land in the 3% to 8% range, boosted by high intent when someone is actively searching for help.
- Real estate: Lead capture pages (property enquiries, valuation requests) frequently reach 5% to 10%, since browsing is common but the CTA is low commitment.
- Local services: Booking and quote-request pages can perform strongly, often 8% or higher, when the searcher has immediate, local intent.
CTA type matters just as much as industry. A newsletter opt-in asks for almost nothing, so it should convert far higher than a demo request, which asks for a phone call and a sales conversation. Webinar signups typically fall between the two. Purchase pages, where money actually changes hands, usually sit at the lower end of any given industry's range, simply because the psychological cost of saying yes is highest.
This is where a lot of marketing teams get their reporting wrong: they chase raw conversion rate without weighing it against lead quality or revenue per visitor. A lead magnet page converting at 15% is meaningless if none of those leads ever buy. Prioritise the metric tied to money, not the metric that looks best in a slide deck.
Does traffic source change what a "good" conversion rate looks like?
Yes, dramatically, and this is the single most overlooked variable when marketers benchmark their pages.
Traffic temperature drives most of that swing. Leadpages and PageStrike both frame this as a segmentation problem: benchmark reports that don't split results by channel are combining ice-cold cold outreach clicks with red-hot email list clicks, then reporting one blended number that describes neither accurately.
Here's the rough hierarchy channel data tends to follow:
- Email: Usually the highest-converting channel, often reaching mid teens or higher, since recipients already know and trust the sender.
- Paid search: Strong performer because searchers are actively looking for a solution, high commercial intent tends to translate into higher conversion.
- Retargeting: Warm by definition, since visitors have already engaged once, retargeting campaigns often outperform first-touch traffic.
- Organic: Solid mid-range performance, varying by how well the page matches search intent.
- Paid social: Typically the coldest traffic on this list, since users didn't ask to see your offer, they were interrupted mid-scroll.
Some benchmark analyses put email conversion two to four times higher than paid social on comparable offers, which is a gap too large to ignore when you're setting targets for a campaign. That's two different traffic temperatures doing exactly what you'd expect.
The practical takeaway: never compare your blended average conversion rate to an industry benchmark. Segment first, then benchmark. A page that looks mediocre overall might be crushing it on one channel and dragging the average down on another.
Why does mobile conversion still lag behind desktop?
Mobile now accounts for the majority of landing page visits, yet desktop still converts noticeably better in aggregate. Unbounce's dataset shows desktop outperforming mobile by roughly 8%, a gap that's shrunk over the years but hasn't closed.
Three culprits show up again and again in mobile-specific audits:
- Slow Largest Contentful Paint (LCP). Mobile connections are less forgiving of bloated images and unoptimised scripts. Compress hero images, lazy-load below-the-fold content, and test your LCP score with PageSpeed Insights before you touch anything else.
- Hidden or buried CTAs. What sits neatly "above the fold" on a 27-inch monitor often disappears entirely on a phone screen. Put your primary call to action within the first mobile viewport, not three scrolls down.
- Form friction. Every extra field is a bigger tax on a thumb typing on a six-inch screen than on a keyboard. Cut fields ruthlessly, and use native mobile input types (tel, email) so the right keyboard pops up automatically.
Pro Tip: Run your landing page through PageSpeed Insights on mobile specifically, not just desktop. A page that scores well on desktop can still fail badly on a throttled mobile connection, and that gap is invisible until you test it directly.
If you fix only one thing this month, fix mobile load speed. It affects every visitor who lands on your page before they even see your offer.
How do you calculate conversion rate correctly?
The formula itself is simple: conversions divided by total visitors, multiplied by 100. Simple math, but the accuracy of your inputs is where most teams go wrong.
Search Engine Land's conversion rate guide recommends using GA4 with properly configured conversion events, rather than relying on raw form submission counts, which tend to double count or miss cross-domain journeys.
A few tracking pitfalls worth checking right now:
- Double-counting conversions when a thank-you page reloads or a user refreshes after submitting, inflating your numerator.
- Cross-domain tracking gaps, especially when your landing page lives on a different subdomain than your booking or checkout tool.
- Inconsistent goal definitions across campaigns, where one team counts "form started" and another counts "form completed" as the conversion event.
Sample size matters more than most reports admit. A page with 40 visitors and 3 conversions technically shows a 7.5% conversion rate, but that number will bounce around wildly with the next handful of visits. As a rough rule, wait until you've got at least a few hundred visitors and enough conversions to smooth out the noise before you treat any rate as a stable benchmark for decision making.
For a clear breakdown of the conversion types you might be measuring, from lead magnets to demo requests, our glossary entry on landing pages walks through the distinctions in plain language. If you want to run the numbers on your own traffic, our conversion rate calculator does the math for you.
What's the fastest way to improve a landing page's conversion rate?
Most underperforming landing pages don't need a redesign. They need three or four specific fixes, and audits of thousands of pages consistently find the same handful of failure modes repeating: vague headlines, no social proof above the fold, competing CTAs, and forms asking for more than they need.
Work through fixes in this order:
- Sharpen the headline. It should state the outcome the visitor gets, not describe your product category. "Get 20 qualified leads a month" beats "Digital marketing services."
- Put your unique value proposition where it can't be missed. One sentence, above the fold, answering "why you and not the next option."
- Add social proof immediately visible on load. A review count, a client logo strip, or a specific result does more work in that first viewport than any amount of clever copy further down.
- Cut to a single CTA. Multiple competing buttons split attention and measurably drag down completion rates.
- Reduce form fields to the minimum you actually need. Every field beyond name and contact detail is a small tax on completion.
- Fix load speed. Especially on mobile, where patience runs out fastest.
Once those fundamentals are solid, move to structured A/B testing. Change one variable per test, whether that's the headline, the CTA colour, or the form length, so you know exactly what caused any lift. Give each test enough traffic to reach a reliable sample before calling a winner; rushing a test with too few visitors is how teams end up "optimising" based on noise.
Pro Tip: Track lead quality and revenue per visitor alongside raw conversion rate. A test that raises conversion rate but fills your pipeline with unqualified leads isn't a win, it's a different problem wearing a better-looking metric.
For a deeper walkthrough of the messaging elements that move the needle first, see our guide to the anatomy of a high-converting landing page.
Which tools help you measure and improve conversion rates?
You don't need a large tech stack to start benchmarking properly, you need a small set of tools used consistently.
- GA4 handles the core job: counting conversions accurately against defined events, and segmenting by traffic source so you're comparing like-for-like.
- Session replay and heatmap tools (the category includes products like Hotjar and FullStory) show you exactly where visitors hesitate, scroll past, or abandon a form, turning guesswork into a visible pattern.
- A/B testing platforms (the category includes tools like VWO and Optimizely) let you run structured, single-variable tests instead of eyeballing before-and-after numbers.
- PageSpeed Insights or Lighthouse flags your LCP score and mobile performance issues before they quietly tank your conversion rate.
A short weekly CRO checklist to keep the momentum going:
- Check conversion rate by traffic source, not blended average.
- Watch one session replay for each major traffic segment.
- Confirm no test is running on a sample too small to trust.
- Review mobile load speed if any campaign traffic has shifted.
- Log one insight, whatever it is, even if no test launched that week.
Generative AI tools have made it easier than ever to produce reasonably good landing page copy quickly, which has raised the baseline quality across the board. But top-decile performance still comes down to strategic differentiation, understanding your specific audience's objections and price sensitivity, something no template solves for you.
Why agencies see faster wins than DIY testing alone
Most of the pages we look at have three to seven fixable issues stacked on top of each other, and the fastest lift usually comes from fixing the cheapest, highest-impact ones first: headline clarity, visible proof, a single CTA, and load speed. That's not a controversial claim, it's just what repeated audits keep finding.
Where an agency earns its retainer isn't magic, it's pattern recognition. We've seen the same failure modes across enough industries, from dealership lead forms to professional services bookings, that we can usually spot the highest-leverage fix in a first look rather than a month of trial and error. Realistic timelines matter here too: expect a meaningful lift within four to six weeks of structured testing, not overnight. If your team has fixed the fundamentals and plateaued, that's usually the signal to bring in outside eyes rather than running another low-impact test.
, Cobus
Get a landing page audit built around real benchmarks
Fixing a landing page against guesswork is slow. An alternative to the trial-and-error approach most businesses default to is to compare your page against the industry, traffic-source, and CTA benchmarks covered above, then receive a prioritised fix list instead of a generic report. A full-service digital marketing agency working with South African businesses can handle the landing page design, Google Ads management, and CRO work needed to move a page from "typical" to "strong" without locking you into a long-term contract.
Start with a free Google Ads audit that shows you exactly where your landing page is losing conversions, and what fixing it is worth in South African Rand terms for your specific traffic volume.
Sources
- Average conversion rate by industry benchmark report
- Landing Page Conversion Benchmarks (2026): What's Good, What's Average, and How to Improve | Leadpages
- Landing Page Conversion Rate Benchmarks 2026: What's Good, What's Great | PageStrike Blog
- Conversion rate guide | Search Engine Land
FAQ
What is the average conversion rate for a landing page?
The commonly cited median across industries is 6.6%, based on Unbounce's analysis of over 41,000 landing pages. Your realistic target shifts depending on industry, traffic source, and what you're asking the visitor to do.
Is a 12% conversion rate on a website good?
It's worth checking your traffic source before celebrating too hard, since warm channels like email or retargeting naturally produce higher numbers than cold paid social traffic.
Is 2.5% a good conversion rate?
It depends heavily on context.
Recommended
- Landing Page Best Practices for South Africa (2026)
- What Is a Landing Page? (Conversion Guide)
- Anatomy of a High-Converting Landing Page
- 11 CRO Test Ideas With Real Conversion Lifts